Sales analysis
Your sales by customer and by month in one table. The bigger the month, the darker the cell.
On this page
Sales analysis puts your sales in one table: a row for each debtor (customer) and a column for each month. Use it to see who buys the most, and who has stopped buying.
The screen
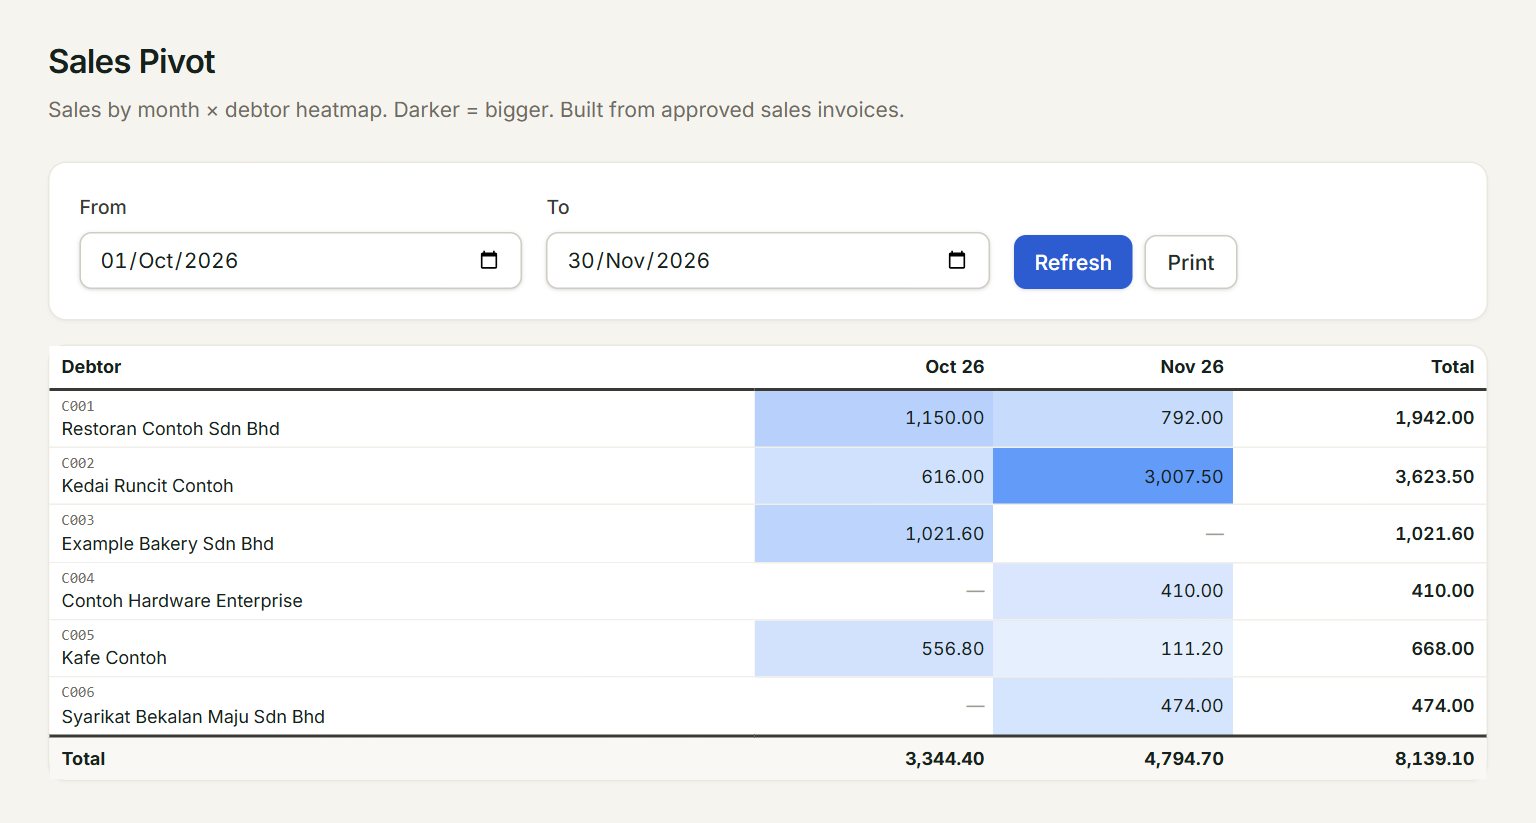
- From and To: the months to show. Each month between them gets a column.
- Refresh: reads the figures again, for example after you post new invoices.
- A month: what each debtor was invoiced that month, tax included.
- A row: one debtor. The darker the cell, the bigger the month. — means no sales that month.
- Total on the right: the debtor's sales for the whole period.
- Total at the bottom: all debtors for each month, and the grand total.
See your sales by customer
- In the menu, open Reports, then Sales analysis. The screen is headed Sales Pivot.
- Set From to the first day of the first month you want.
- Set To to the last day of the last month. The table updates.
- Read across a row to follow one customer month by month.
- Read down a column to compare customers in one month.
A customer who bought every month and then shows — may have gone to a competitor. Give them a call.
If something goes wrong
- No sales in this period.: no sales invoices are dated between From and To. Widen the dates.
- This month's new invoices are missing: click Refresh, and check that To is on or after their date.