Profit and loss
Income, cost of sales and expenses for a period, and the profit or loss they leave.
On this page
The profit and loss shows what the business earned and spent between two dates, and the profit or loss left over. Use it at month end, or any time you want to know how the year is going.
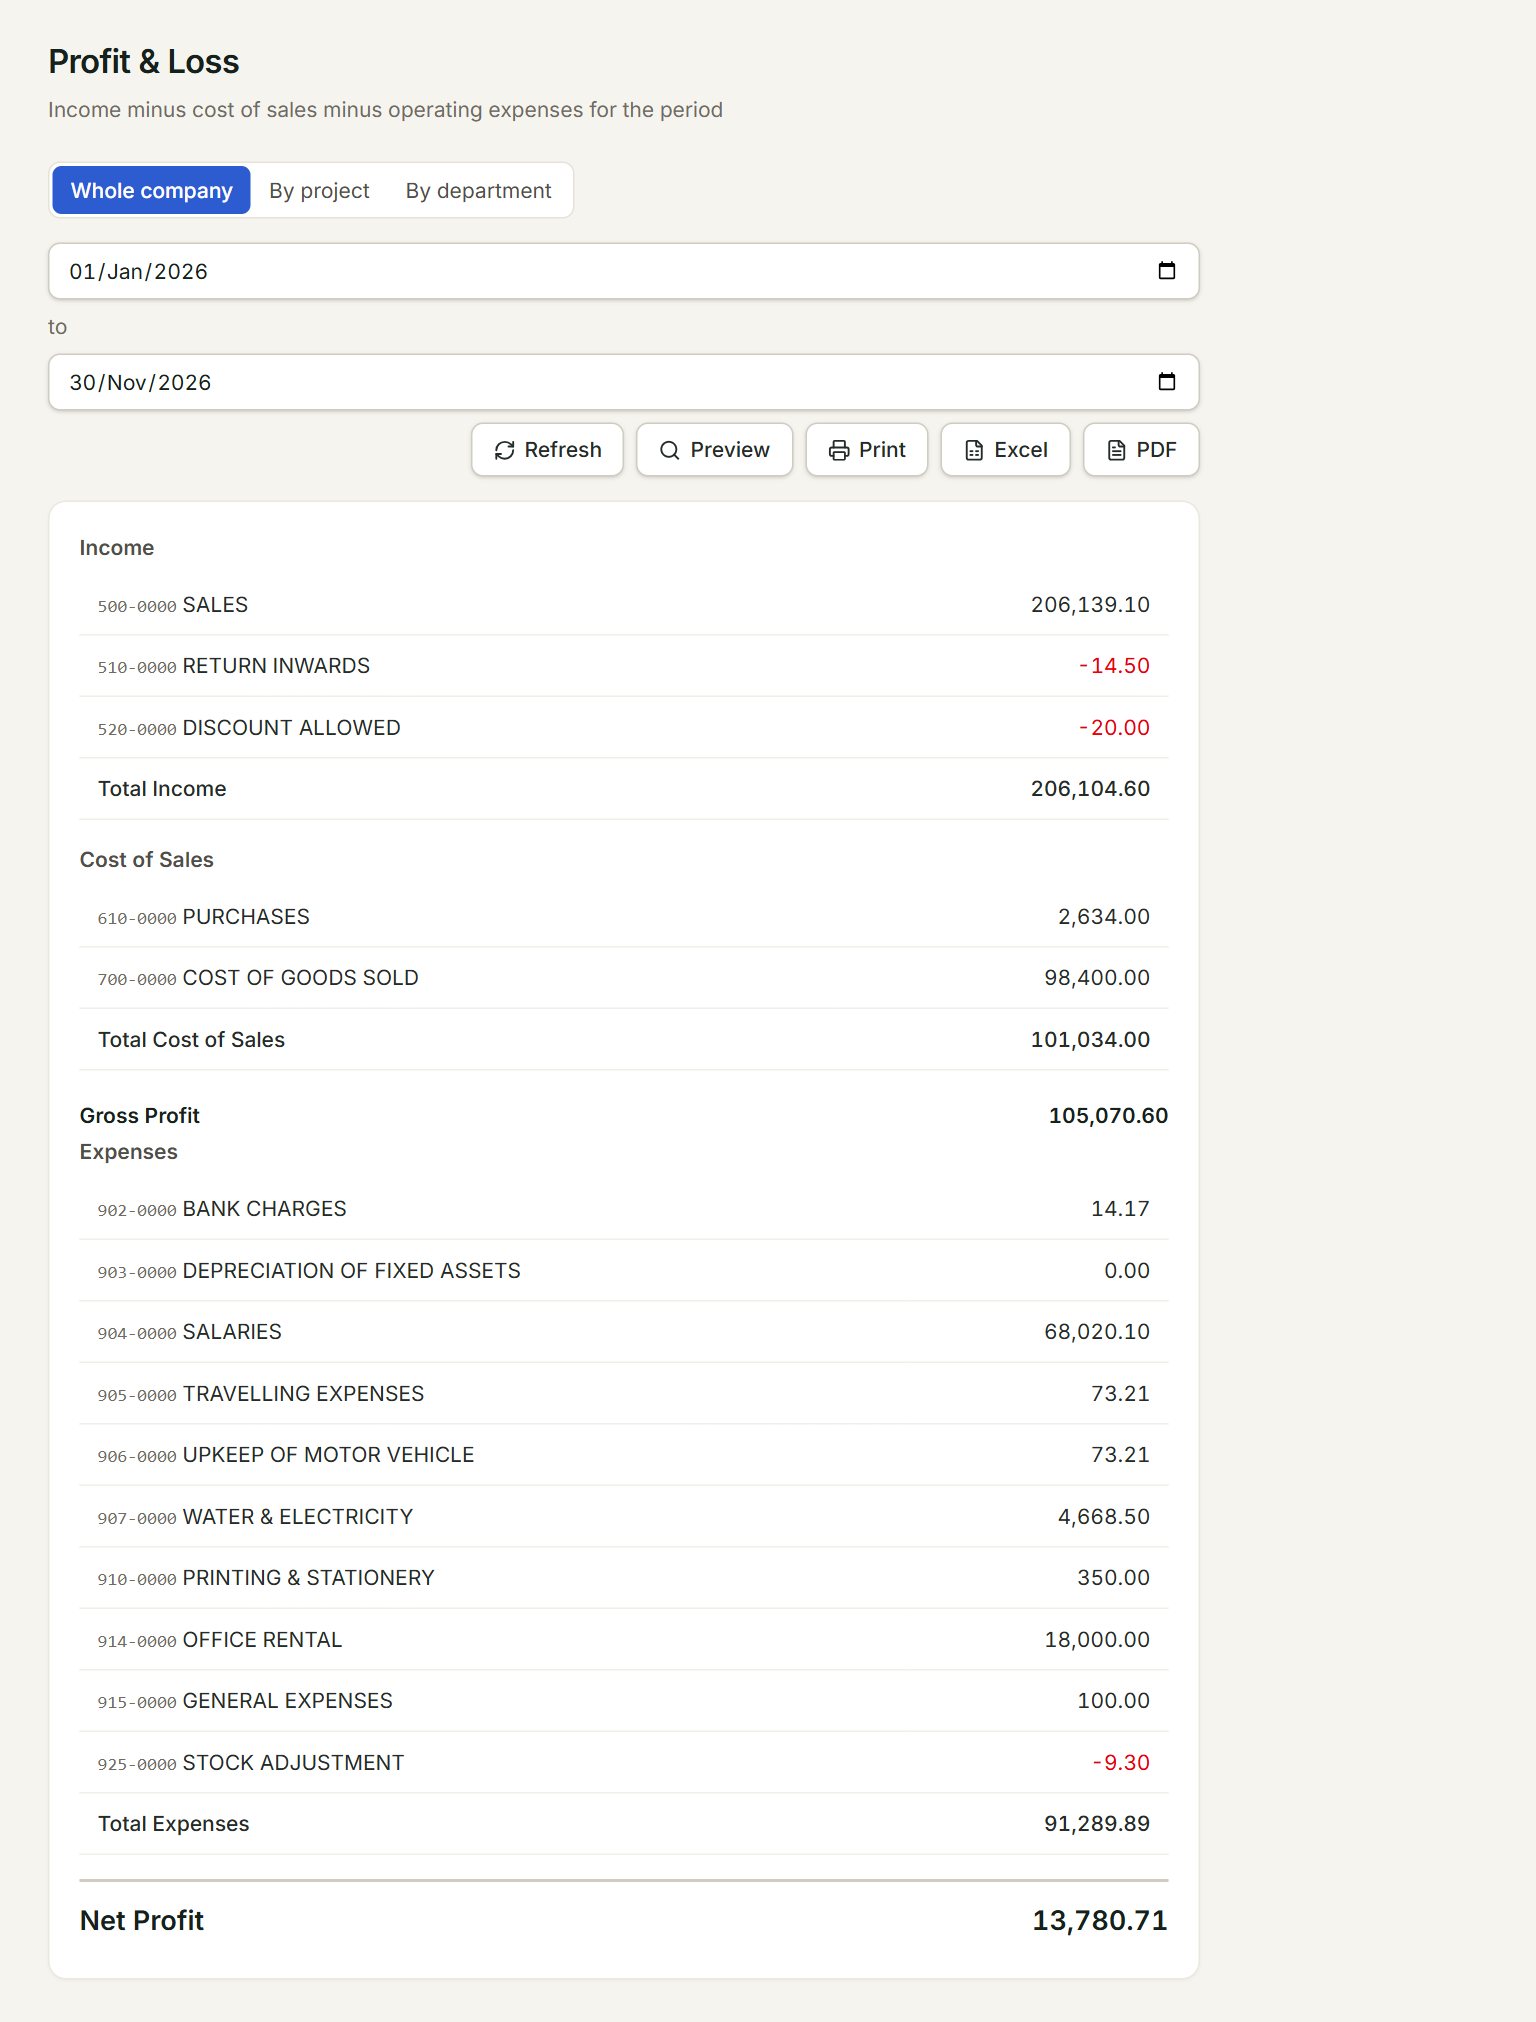
- Whole company, By project and By department: the three views of the report.
- The period: from the first date to the second.
- Refresh: runs the report again with the latest postings.
- Preview, Print, Excel and PDF: look at, print or download the report.
- Gross Profit: income less cost of sales.
- Net Profit: gross profit less expenses. A minus figure is a loss.
Run the report
- In the menu, open Reports, then Profit and loss.
- Set the two dates, for example 1 January to the end of last month. The report runs as soon as you change a date.
- Click Excel or PDF to keep a copy, or Print.
Each heading lists its accounts: Income, Cost of Sales and Expenses. A heading with nothing posted shows — none —.
By project or department
Click By project or By department to see the same figures for each project or department you tagged on your lines. See Projects and departments.
If something goes wrong
- A sale or a bill is missing: check its date is inside the two dates. Voided documents are not counted.
- The figures look old: click Refresh. A report open in another tab does not update by itself.